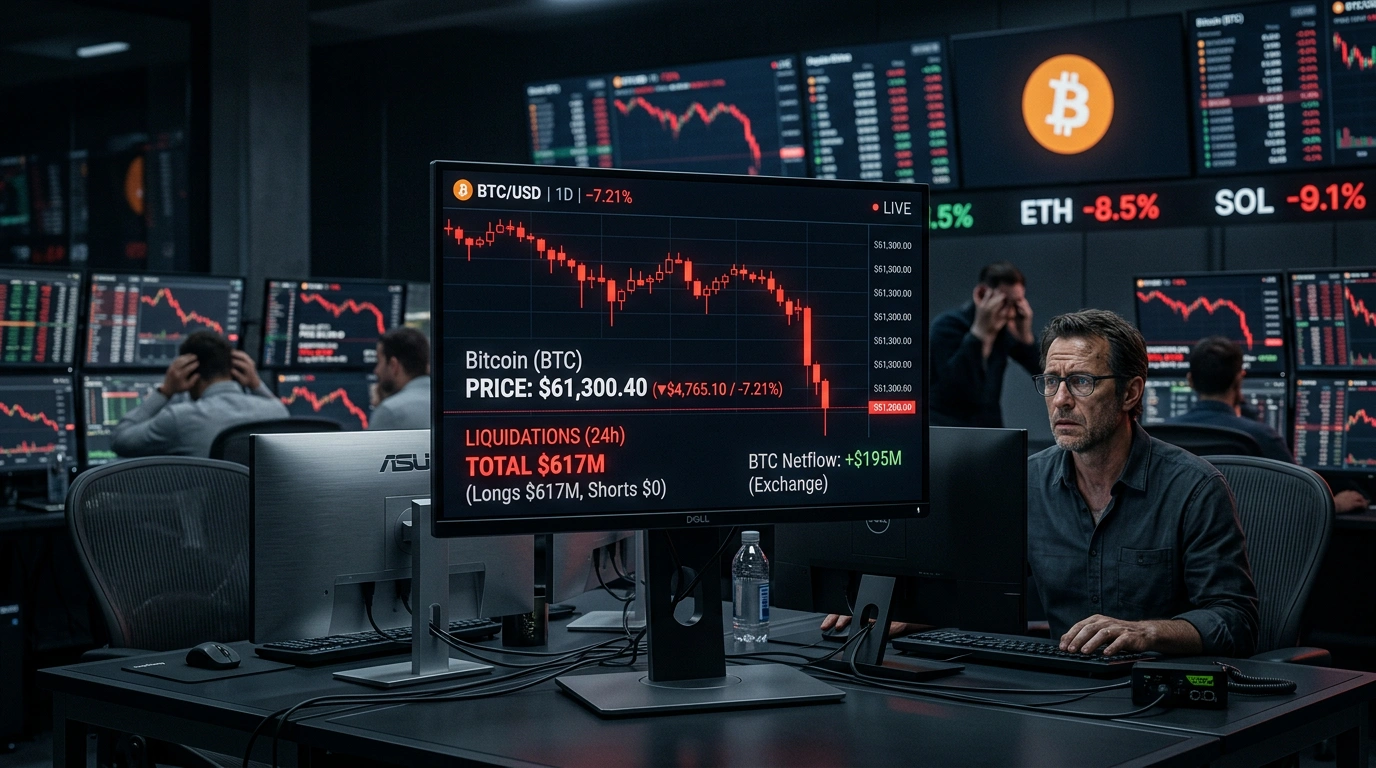
Bitcoin dropped to $61,300 on June 4 and triggered more than $617 million in long liquidations. That is the lowest price since March 2026. The price bounced back to $64,700 within hours, but the debate over what happens next has split traders into two camps.
What Happened on June 4?
Bitcoin accelerated lower on Thursday morning and hit $61,300, where buying demand proved strong enough to stop the slide. From that level, the price recovered 5.52% to $64,690. Market observers linked the rebound to reports of a ceasefire agreement between Israel and Lebanon. Risk appetite returned as geopolitical pressure eased, and capital moved back into risk assets.
Total Bitcoin liquidations over the 24-hour period exceeded $737 million. Long positions accounted for $617 million of that total. Traders who had positioned for a rally got stopped out in a single session. The bounce looks encouraging, but similar recoveries have appeared before deeper drops, so analysts are not calling a bottom yet.
How Do Forced Liquidations Work and Why Were There So Many?
To understand the scale, it helps to know the mechanics. Most active crypto traders borrow funds from an exchange to open a position larger than their own capital. Here is how the chain plays out:
- A trader deposits $1,000 and opens a $10,000 long at 10x leverage.
- If the price drops 10%, the loss equals the full deposit amount.
- The exchange closes the position automatically to prevent the trader going negative.
- Each closure adds selling pressure to the market and accelerates the move lower.
When many closures happen at the same time, a cascade forms. The first wave of sales triggers a second, that triggers a third. The situation was made worse by the fact that many traders had built long positions at $65,000-$70,000, expecting the rally to continue. When the market reversed, the system was carrying too many exposed positions. According to CoinGlass data, the $617 million in long liquidations ranked among the largest single-day figures of the year.
What Does Technical Analysis Show?
The weekly Bitcoin chart currently shows a bear flag pattern. This setup forms when a strong downtrend pauses in a short sideways range, then resumes lower. If the flag breaks downward with volume, the measured target sits around $50,000-$52,000. A bear flag does not guarantee a drop: it is a pattern with a certain probability, and traders weigh it alongside other signals.
The critical support level is the 200-week simple moving average (SMA), currently sitting near $61,800. This indicator has a well-documented history in Bitcoin market cycles: it marked the bottom zone during the 2015, 2018, and 2020 bear markets. Each time BTC approached this line, demand formed a base for a later recovery. The June 4 drop touched $61,300, just below the SMA, but the level held. A weekly candle closing below $61,800 would signal a structural shift for many analysts.
What Are Traders Saying?
Views are divided. Trader RidaaXBT sees the move as a leverage flush and expects a relief rally toward $69,000-$70,000. Analyst ZordXBT points to the long lower wick on the June 4 candle: buyers stepped in aggressively near $61,300 and held the level. Both read the wick as evidence of demand at lower prices.
Trader Hitman42.eth takes the opposite view. He warns the bounce may turn into a bull trap. If BTC fails to hold above $65,000-$67,000 in the coming days, bearish momentum could return. Similar false recoveries played out several times during 2022, and each time the price went on to set new lows.
What Comes Next?
Two scenarios are running in parallel right now. First: the drop to $61,300 already marked the bottom, leveraged longs have been flushed out, and BTC will gradually move toward $69,000-$70,000. Second: the bounce is temporary, and the next wave of selling breaks $61,800 toward a target of $50,000-$52,000.
Watch two things over the next few days: whether BTC holds the 200-week SMA above $61,800, and whether price can close above $65,000 on several consecutive daily candles. A second rejection below $62,000 adds significant weight to the bearish case. A clean break above $67,000 strengthens the bulls. Those looking to exchange Bitcoin for hryvnia should factor this uncertainty into timing decisions.


Comments
Your email address will not be published. Required fields are marked *