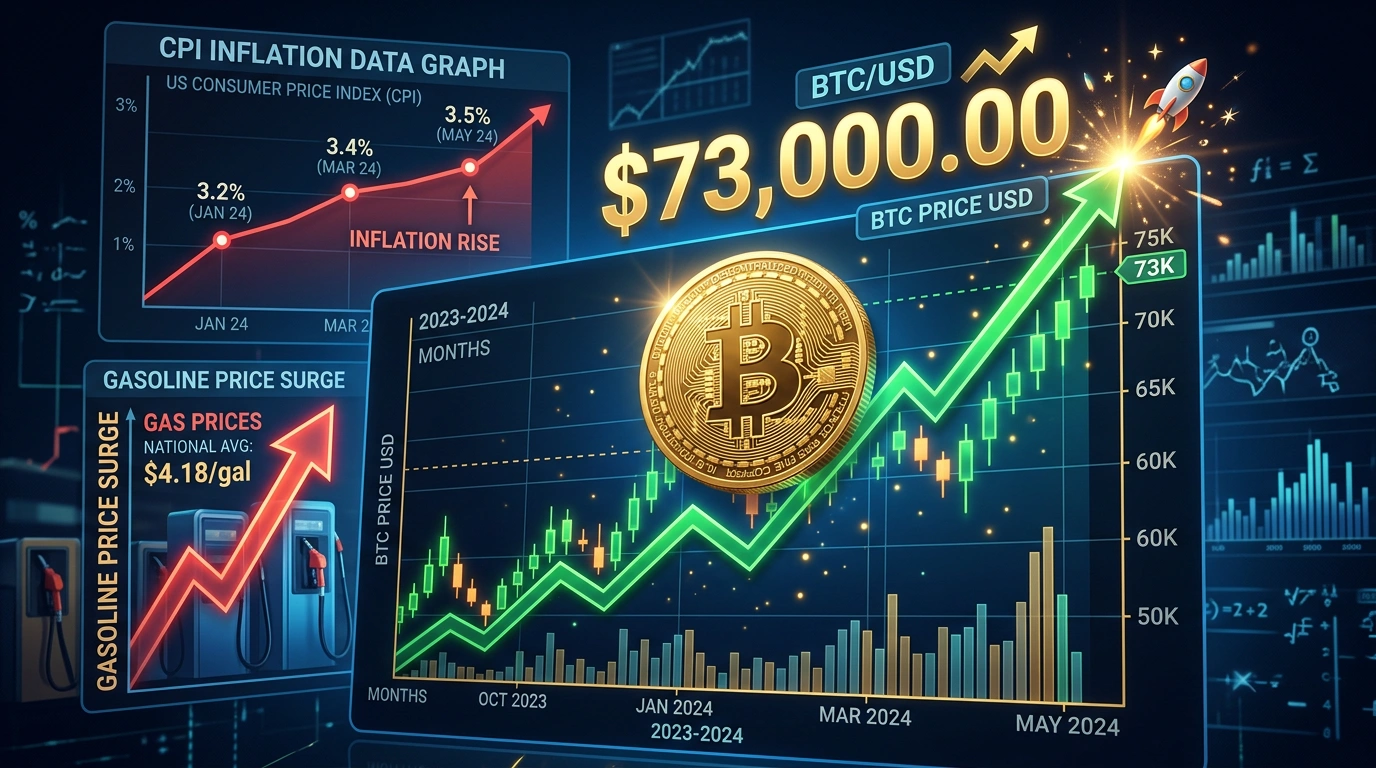
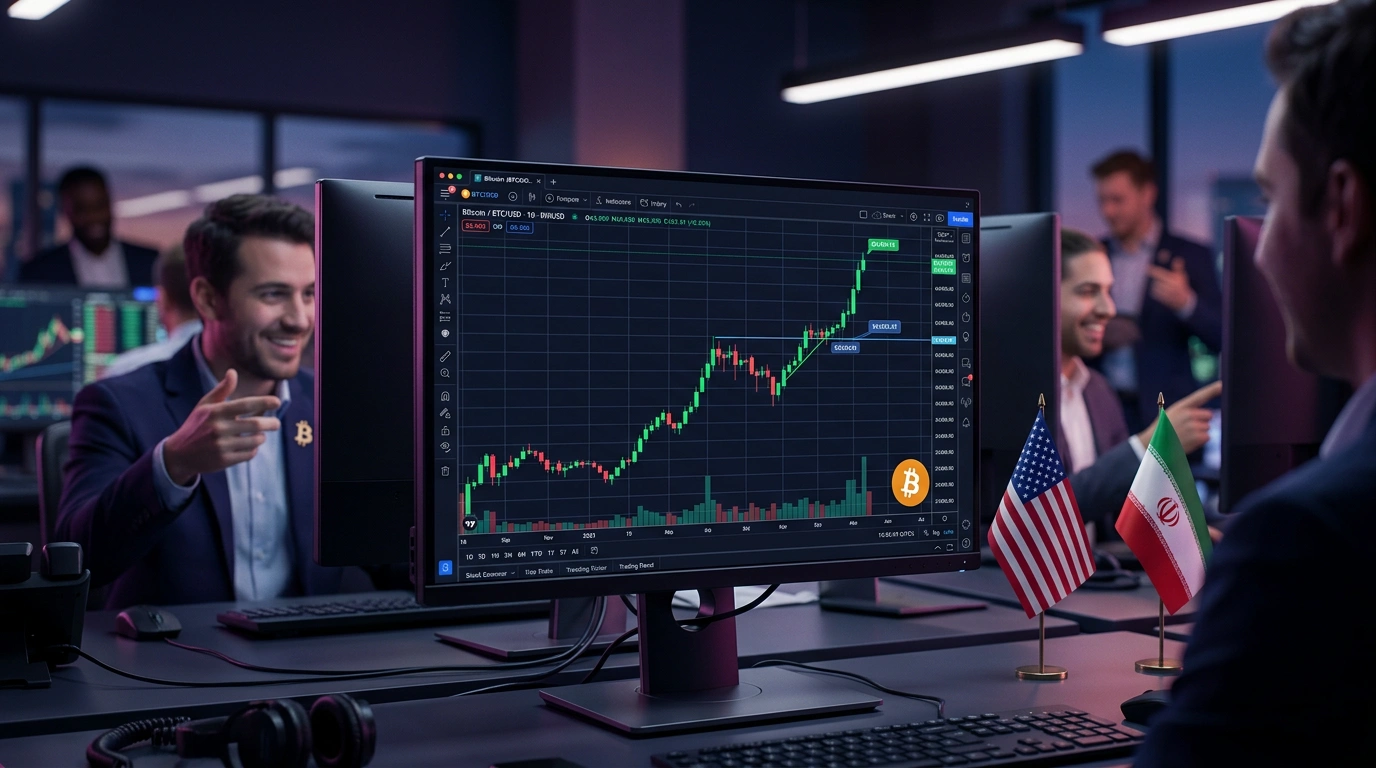
On Friday, April 10, Bitcoin reached $73,000 - a fresh local high after US markets opened. The trigger was March CPI data that came in below market expectations. This was the first inflation report to capture the price impact of the US-Iran conflict.
What the data showed
The Bureau of Labor Statistics released March CPI on April 10. Annual inflation came in at 3.3%. The market expected 3.4%. A small miss, but enough to move prices.
Gasoline surged 21.2% in a single month, making it the largest monthly gain in nearly 60 years. The full energy index rose 10.9%, accounting for about three-quarters of the monthly CPI increase. Other components fell enough to keep the headline number below forecast. The Kobeissi Letter confirmed the gasoline spike was the biggest monthly jump since 1967 and the energy index rise the largest since 2005.
Why markets read this as good news
The energy shock looked alarming. But traders focused on core CPI, which strips out food and energy. That is the reading that drives Fed policy decisions. A stable core gives the central bank less reason to tighten further.
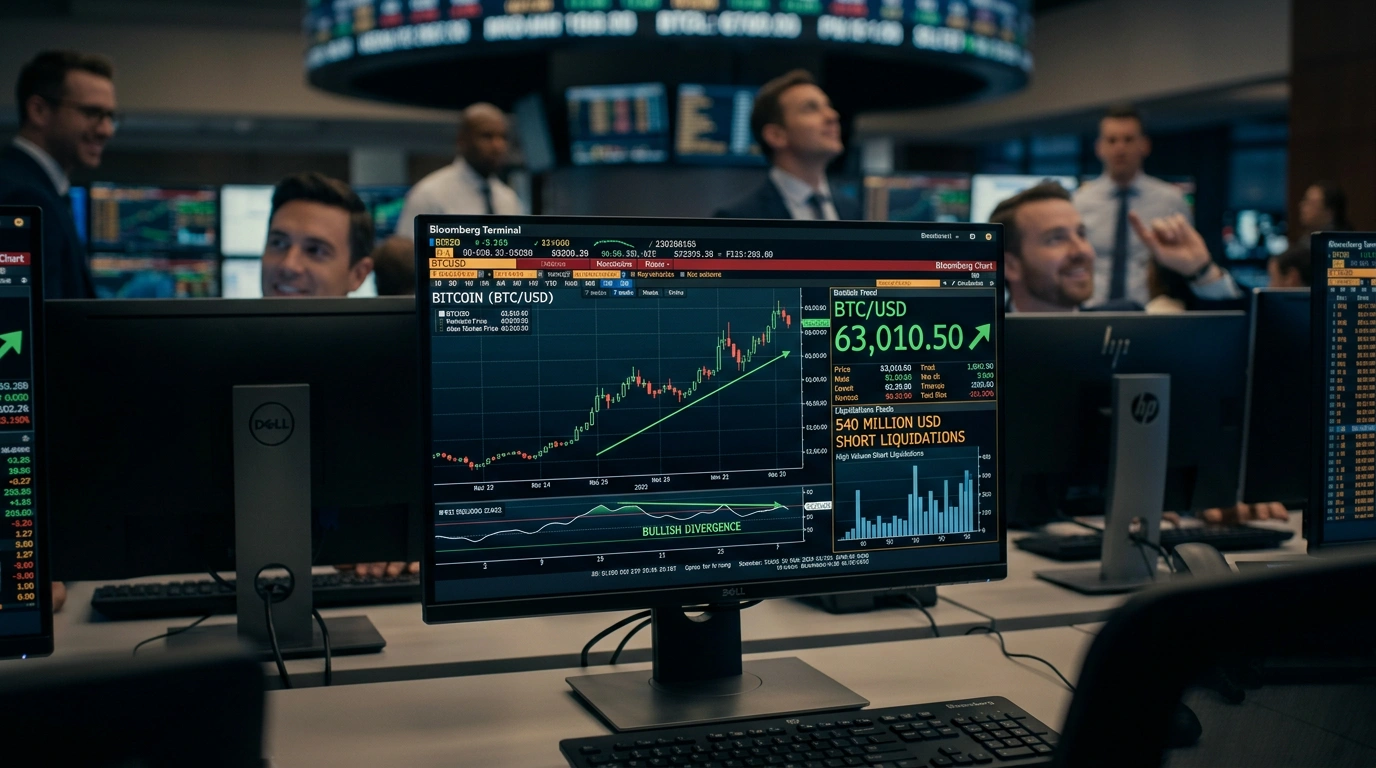
US stocks barely moved after the release. Bitcoin reacted more sharply and pushed through $73,000. Crypto markets have gotten faster at pricing in macro data than traditional assets.
Fed: no rate cuts priced in
CME Group's FedWatch Tool shows no rate cuts expected at upcoming Fed meetings. That view was already locked in after Thursday's PCE index release. A below-forecast CPI did not shift it. Monetary policy stays tight.
Narrowing wedge and key levels
Trader JDK Analysis flagged that BTC/USD has been moving inside a narrowing wedge, a pattern analysts have tracked since February. How price reacts at the current local high will decide the direction of the breakout. The main liquidity levels: support near $71,000 below and the $73,000-74,000 cluster above.
Bitcoin's RSI is tracing a pattern last seen at the end of the 2022 bear market - a potential bullish signal. Those planning to exchange Bitcoin for dollars near current levels should treat the $73,000-74,000 range as the nearest resistance to watch.
What comes next
March CPI gave the market a short-term reason to push higher. Bitcoin is testing the key $73,000-74,000 liquidity zone. Holding above it could open the path to new local highs. The Fed meeting and fresh macro data will be the next market catalysts.

Comments
Your email address will not be published. Required fields are marked *