
Bitcoin is closing the second quarter of 2026 with a 12% loss after a 22% drop in Q1. For the first time since 2022, BTC is posting back-to-back quarterly losses. Today, June 30, Q2 officially closes with the price near $59,800.
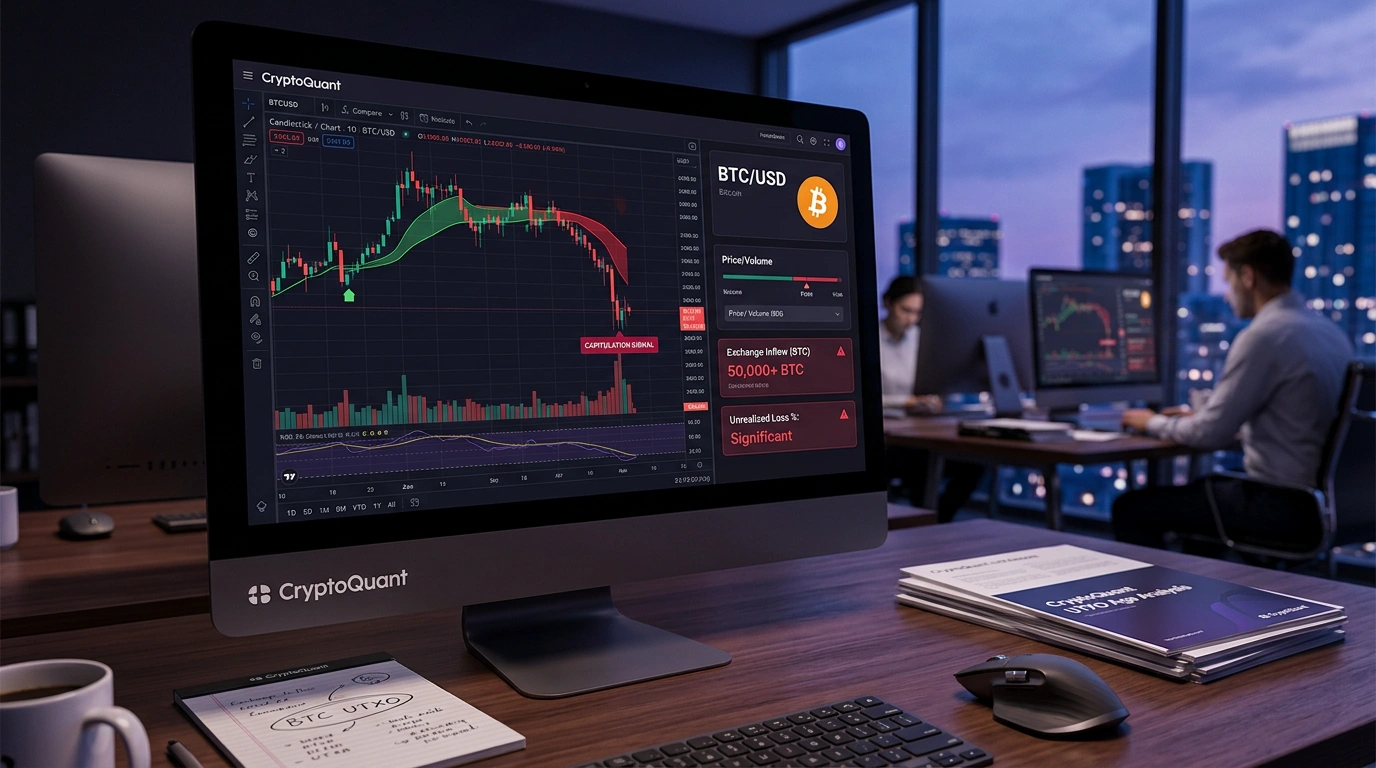
The quarterly low was set on June 26 at $58,115, marking a 20-month bottom. The recovery since then has been shallow. The $60,000 level remains resistance, as every attempt to break above it has been met with sellers. The market is now testing whether the $58-$60k range is a base or merely a pause before further decline.
Options market: 7-to-1 put dominance
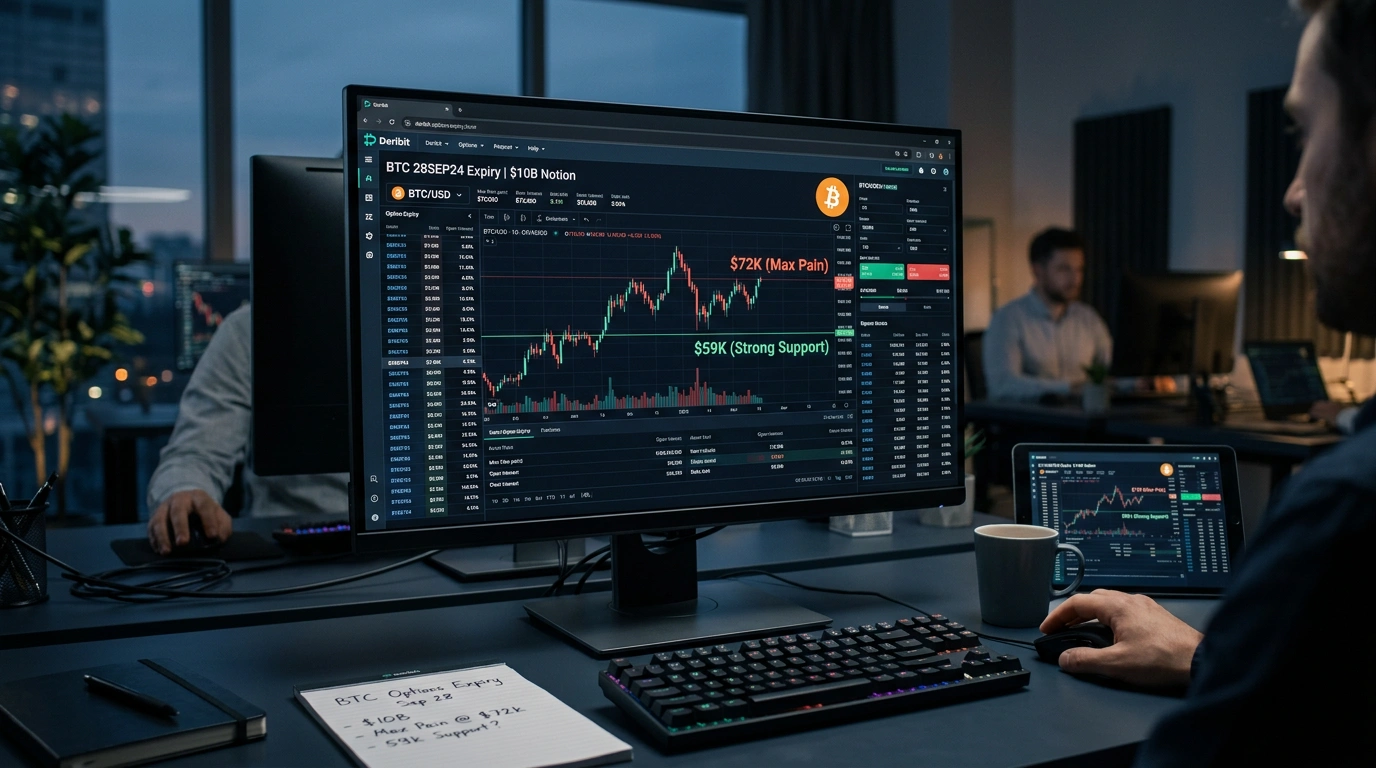
On Deribit on Friday, June 27, the premium paid on put options (the right to sell BTC) totaled $115 million, while call options (the right to buy) collected just $16 million. The 7-to-1 ratio was the highest in over 12 months.
The 30-day options delta skew on Deribit reached 19%. At that level, market makers demand a significant premium for taking on downside exposure. The indicator has stayed above 15% for four consecutive weeks, making fear a persistent market condition rather than a one-off signal.
Analysts at CoinTelegraph note that such a put-call imbalance does not automatically confirm that bears are opening fresh short positions. Large players may have bought puts to hedge long exposure. Still, the abnormally high cost of downside protection shows genuine discomfort among market participants.
ETF outflows and rotation into chip stocks
Spot Bitcoin ETFs recorded $1.79 billion in outflows for the week of June 23-27. The trend began in March and has not seen a single significant week of net inflows since. That consistency sets the current pressure apart from the typical corrections of past cycles.
At the same time, semiconductor funds have taken in more than $20 billion in cumulative inflows. The leading iShares semiconductor ETF rallied 81% from its low. The Kobeissi Letter tracked a broad rotation by retail investors out of Bitcoin and gold and into chipmaker stocks, driven by the AI boom.
Goldman Sachs projected 22% annual earnings growth for S&P 500 companies in a recent report. The Federal Reserve under Kevin Warsh is keeping monetary policy tight, and the dollar is trading at a 12-month high. These factors together raise the cost of holding uncorrelated assets and pull capital from crypto into traditional markets.
Altcoins: losses twice as deep
Ethereum closed Q2 down 25% and has dropped 47% year-to-date. The price trades near $1,570, back to late-2023 levels. Solana is down 43% in 2026. DOGE, XRP, and HYPE each posted losses above 10% in the past week.
ETH stakers are not exiting en masse. Outflows from the staking contract remain minimal despite current prices. Long-term holders are staying put, and the selling pressure is coming mainly from the spot market and derivatives rather than from institutional exits.
Strategy: $1.25B reserve and supply pressure
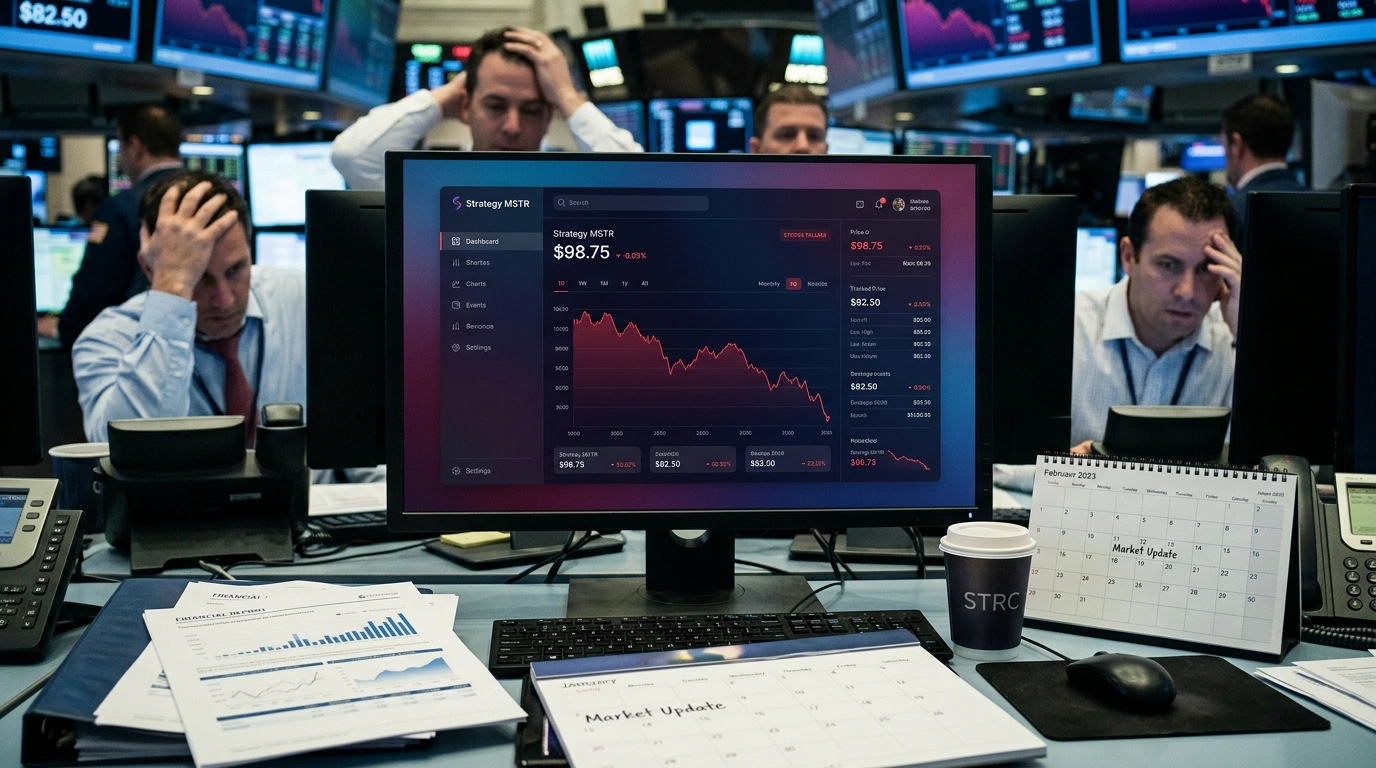
On June 29, Strategy (MSTR) announced a $1.2 billion cash reserve built from recent share sales and set aside $1.25 billion in Bitcoin for potential future sales under the new "Digital Credit Capital Framework". That same day MSTR shares snapped a nine-day losing streak. The stock still sits 42% below its peak from the Bitcoin sale a month ago.
The announcement eased some concerns about the company's debt coming due in 2027. The market, however, is reacting to the mere existence of $1.25 billion in a "available for sale" bucket: that is potential supply overhang, even if no actual sales occur in the near term.
Strategy's market net-asset-value (mNAV) fell below 1 for the first time. The market is now valuing the company at less than the Bitcoin on its balance sheet. The premium that for years gave Saylor cheap access to capital for BTC purchases is gone. For the first time in several years, MSTR cannot raise inexpensive money on an inflated valuation.
What history shows: 2018 and 2022
Over the past decade, Bitcoin has twice closed two consecutive six-month periods in the red: in 2018 and in 2022. Both times, at least a three-year uptrend followed. The 2019-2021 and 2023-2025 patterns share the same structure.
The second red six-month candle of 2026 closes today, June 30. Trader @nobrainflip posted this chart on X on June 28 and collected thousands of retweets. That said, the parallel is time-based, not mechanical. Bitcoin in 2026 operates in a different regulatory and macro environment than in 2018 or 2022.
A Fear and Greed Index reading of 18 ("Extreme Fear") adds to the picture. In October 2022, it reached 6; in June 2022, it hit 8. Both times, recoveries lasting 18 to 36 months followed. The current reading of 18 falls in the zone analysts have previously classified as an accumulation area.
$55,000 or reversal: what the market expects
The $60,000 level has been resistance since June 25. CoinTelegraph analysts put $55,000 as the next technical support in case of a breakdown. Futures markets give no clear signal. Open interest is not falling, which points to risk redistribution between participants rather than mass position liquidation.
- Bearish case: capital rotation into chipmaker stocks continues, ETF outflows hold steady, and the $1.25B Strategy reserve sitting in "available for sale" status weighs on supply.
- Bullish case: two consecutive red six-month closes combined with a Fear and Greed reading of 18 have previously coincided with long-term bottoms (2018 and 2022).
- If Q3 repeats the pattern of 2019 and 2023, a recovery could start as early as August or September. The market has not yet provided data to confirm this scenario.
On balance, the quarter closes in Extreme Fear with technical weakness, but with parallels to two prior cycle bottoms. Until $60,000 turns from resistance into support, any bounce is better read as a correction within a downtrend rather than the start of a new cycle.
Comments
Your email address will not be published. Required fields are marked *