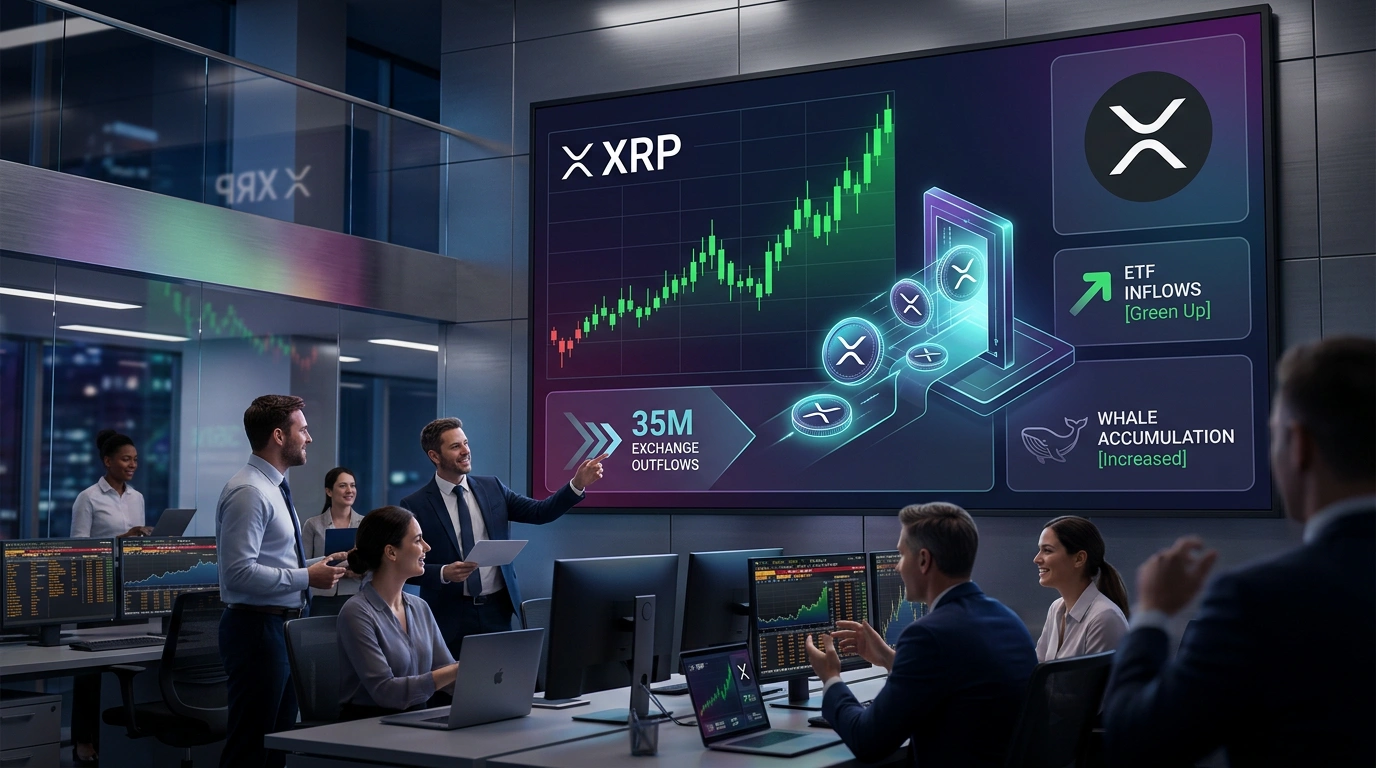
XRP is trading near $1.43, and nearly 35 million tokens left exchanges in the past 24 hours. The sixth-largest daily outflow of 2026, according to Santiment. Three independent market signals aligned on the same day. Exchange outflows, a three-week ETF inflow streak, and whale flows turning positive.
Sixth-Largest Daily Exchange Outflow of 2026
Analytics platform Santiment recorded roughly 34.8 million XRP leaving centralized exchanges on April 25. The tokens moved to private wallets and custodial solutions. Holders who transfer coins to cold storage rarely plan to sell in the near term. Less XRP sitting on trading platforms means less potential sell pressure on order books.
This pattern is well-established in the Bitcoin market. Shrinking available supply on exchanges makes prices more sensitive to incoming demand. For XRP, the same logic has played out twice this year. In March, a similar outflow spike preceded a roughly 20% price gain, and the February surge was followed by an even stronger move, with XRP climbing 48-50% over the next several weeks.
There is one more piece of context. This sixth-highest daily outflow happened quietly. XRP barely moved for several weeks, and social media activity stayed low. Outflows during a calm market tend to be a more reliable signal than the same numbers during a hype cycle, when motivations can vary widely.
At current levels near $1.43, XRP sits roughly 60% below its 2024 all-time high. That gap is why any signal of changing behavior from large holders gets more attention than it would in a neutral market phase.
Three-Week ETF Inflow Streak: $82.88M and $1.1B AUM
US spot XRP ETFs recorded three consecutive weeks of net inflows. Total inflows over that period reached $82.88 million per SoSoValue data, pushing assets under management past $1.1 billion. Modest compared to Bitcoin funds, but three steady weeks of inflows after months of choppy flows looks like a genuine shift.
XRP ETFs received regulatory approval in early 2026. Their first months were uneven. One week inflows, the next outflows. AUM stabilizing above $1 billion alongside three straight weeks of inflows suggests the institutional buyer base is gradually taking shape.
Institutional demand for XRP via ETF products is growing. A fourth consecutive week of inflows would be rare for the altcoin market. Large funds track these streaks alongside on-chain data, and the current cluster of confirmations puts XRP on their radar.
Whale Flows Turn Positive for First Time Since Early 2026
CryptoQuant data showed the 90-day moving average of large-wallet flows in the XRP Ledger network crossed above zero. For most of early 2026, the metric sat in negative territory. Negative readings mean large addresses were net sellers or were moving tokens to exchange accounts ahead of sales.
Whale flows are not a direct forecasting tool. The metric tracks net token movement to and from large addresses. Positive values mean whales are receiving more than they send to exchanges.
But that behavior shapes the real market. When big holders shift to accumulation, sell-side pressure eases, and any incoming buying interest meets less resistance. Retail traders react to price; whales help set it.
The previous time whale flows turned positive coincided with XRP's May-July 2025 rally, when the token posted one of the strongest gains among top altcoins that quarter. The current reversal mirrors the same transition from distribution to accumulation. All three data sources point in the same direction.
Technical Target: $1.87-$1.89 by June
On the weekly chart, the XRP/USD pair has been trading inside a falling wedge for two years. Both trendlines slope downward and gradually converge. In April 2026, price bounced off the lower boundary and returned to the middle of the pattern. A bounce from the lower line raises the odds of testing the upper boundary.
The breakout target is the $1.87-$1.89 zone. That level aligns with the 50-week EMA and the 0.5 Fibonacci retracement. From current levels near $1.43, that is about 30% higher. The technical timeline points to June 2026. Two separate methods confirming the same zone adds weight to the target.
XRP is already up more than 30% over the past three months. The asset has shown it can move in that kind of range. The technical setup describes structure, not a guaranteed outcome.
One more point. The $1.87-$1.89 zone overlaps with a heavy resistance area from 2024, where a large volume of trades occurred. It is not just a mathematical level, but a price region where the market has made decisions before.
Three Risks That Could Break the Setup
The main technical risk is clear. A decisive close below the wedge's lower trendline would invalidate the bullish case. The next support sits at $0.98, which aligns with the wedge apex and the 0.786 Fibonacci level. That is roughly 31% below current prices.
- Bitcoin correlation. If the leading cryptocurrency drops below $70,000, XRP will likely follow the broader market regardless of on-chain signals
- ETF data is still young. Three weeks of inflows is not enough to confirm a durable trend change
- Exchange outflows are not always accumulation. Some volume may go to OTC desks for large off-exchange trades without leaving a public trail
- Regulatory backdrop: the Ripple vs. SEC case is closed, but broader pressure on the US altcoin market has not fully eased
Three signals rarely align without the market eventually reacting. If Bitcoin holds above key support and ETF inflows continue into a fourth week, XRP has real technical room to make a run at $1.87-$1.89. But the setup needs confirmation. Without a close above the wedge's upper trendline, all these signals remain just potential.


Comments
Your email address will not be published. Required fields are marked *